A Little Fib...
Posted October 17, 2023
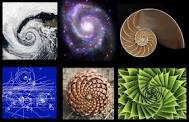
Riddle me this: What does market behavior have to do with the proportions of the facial features in the Mona Lisa, the ratio of the length of the arms of a spiral galaxy to its diameter, the symmetry of flower petals and pinecone scales, or the ratio the sizes of the cells in the nautilus shell? Have you ever heard of the Golden Ratio or how it is derived from the Fibonacci Sequence? For these and other nerdy facts, read on!
The name Fibonacci is actually a contraction of the words fillus and Bonacci translated as “son of Bonacci.” His name was Leonardo Bonacci and is accredited with expanding the use of Hindu-Arabic numeral system in his 1202 Opus “Liber Araci,” translated as “Book of Calculation.”
The Fibonacci Sequence Numbers are: 0, 1, 1, 2, 3, 5, 8, 13, 21, 34, 55, 89, 144, 233, 377, 610, 987, 1597, 2584, 4181, 6765, 10,946, 17,711, 28,657, 46,368, 75,025, 121,393… out to infinity. As you see the next number in the sequence is defined by the sum of the preceding two. Fibonacci ratios are determined by dividing adjacent numbers. As the numbers get larger, the ratio of adjacent numbers approaches the number 0.618. To wit, 1/1 = 1.0000, 2/3 = 0.66667 13/21 = 0.61904, 55/89 = 0.61797, 75,025/121,393 = 0.61803. Here is another spooky fact: The inverse of 0.618, interestingly enough, is 1.618 or 1+0.618. Known as the "Golden Ratio" 1.618 resonates in many places throughout art and nature, from the arrangement of flower petals, the configuration of the cone scales in a pinecone, the ration of the size of adjacent cells inside the nautilus shell, the proportions of Davinci’s Vitruvian Man, and the ratios of lengths of the arms of Spiral Galaxies, just to name a few examples.
Ever searching for an edge, market techies applied Fibonacci ratios to market price action. And if you do the same, amazingly and (spookily) you’ll see some interesting, if not downright compelling support/resistance levels at the Fibonacci Retracement levels. If you use a Fibonacci Retracement tool on your trading platform, you will create the Fibonacci retracement lines by examining an interval defined by a high and a low in the time frame of interest. The retracement lines within that range are defined from ratios of adjacent Fibonacci numbers. Once the user defines the high and low, the platform will overlay lines that extend beyond the range to the right at the Fibonacci levels of 100%, 78,6%, 61.8%, 50%, 38.2%, 21.4%, and 0.
But wait a second, how do we get 0.5, 0.786 0.382, and 0.214?
As noted above, the retracement lines are percentages of the Hi/Low Range as derived from ratios of adjacent Fibonacci numbers: The bottom of the channel is 0%, where 0 is the first number of the sequence, 1/0 is undefined. 1/1=100% (which is the ratio of the two adjacent Fibonacci numbers 1 and 1. Moving along the sequence, 1/2= 0. 5= 50%, the 0.618 is 61.8% is the ratio of adjacent numbers as the sequence extends out to infinity, the square root of 0.618 is 0.786. gives us 78.6%. Finally, (1-0.618) gives the 38.2%, (1-0.786) yields 21.4%.
Are the Fibonacci retracement levels real? One could argue that since the price action of the market is driven by the primal human emotions of fear and greed, which themselves are natural phenomena, one could expect to see that natural pattern to resonate in a Fibonacci sequence. Alternately, one could argue that since traders are all looking at the same retracement levels, these lines are nothing more than self-fulfilling prophecies, as traders create demand and supply surges at these levels.
To which tribe do you belong? True believer or skeptic? Draw the lines and see for yourself!

